Project Preview & Debugging
After using the main editor panel to import assets, build scenes, configure components, and adjust properties, we can now preview and build to see how the game will look when running on the Web or Native platform.
Selecting the preview platform in the editor
At any time during game development we can click the Preview button at the top of the editor window to see the game in action.
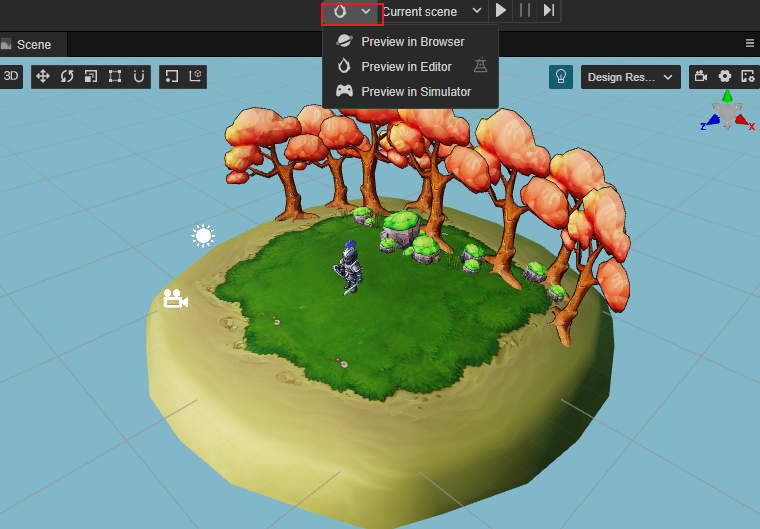
The left drop-down menu allows selecting the platform for previewing, currently Browser, Preview in Editor and Simulator are supported.
: preview button, click it to run the preview
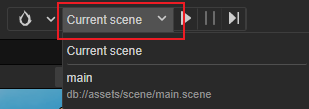
On the right side of the Preview button you can select the scene to preview, the dropdown box will list all the scenes in the project, by default Current scene is used.
: refresh button, click this button to refresh all opened preview pages. To refresh the preview page automatically after the save scene operation, select Cocos Creator/File -> Preferences -> Preview in the editor main menu, and then check Refresh preview page when saving scene.
Note: double-click is needed to open the scene to preview the game content. If there are not any scenes open, or if an empty scene is created, no content will show.
Browser
After selecting Browser to preview, click the Preview button next to it to run the web version of the game directly in the default desktop browser. It is recommended to use Google Chrome as the browser for previewing and debugging during development, as Google Chrome has the most comprehensive and powerful DevTools.
At the top of the browser preview screen there are a series of controls to control the preview effect:
- The leftmost menu is used to select the scale size of the preview window to simulate the display effect on different mobile devices, and the device resolution can be added manually in Cocos Creator/File -> Preferences -> Device Manager.
- Rotate: decide whether to display landscape or portrait screen
- Debug Mode: choose which levels of log in the script will be output to the browser console
- Show FPS: allows choosing whether to display debug information such as frames per second and number of drawcalls in the bottom left corner
- FPS: allows limiting the maximum number of frames per second
- Pause: pause the game
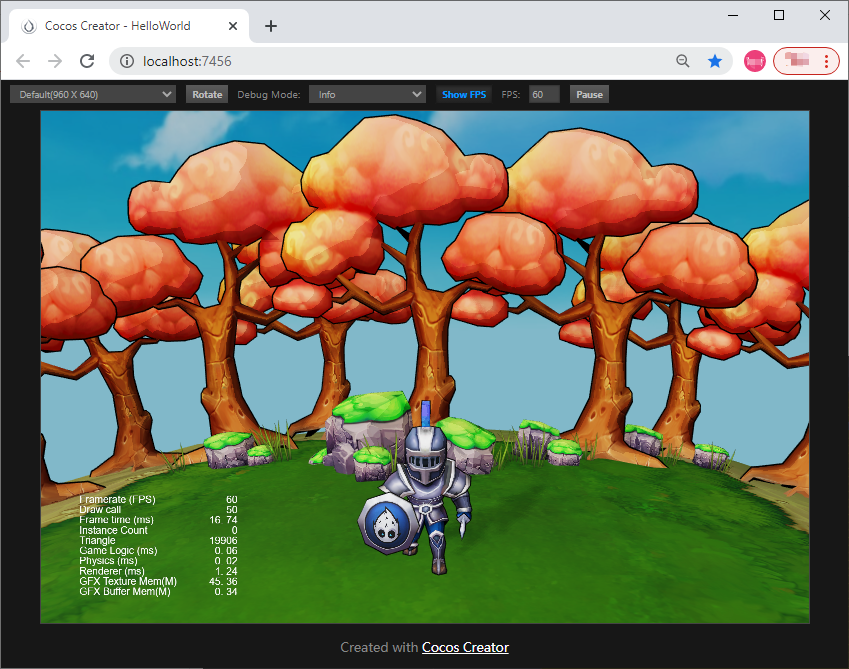
Creator supports the feature of web preview customization, please refer to the web preview customization workflow documentation for details.
Browser compatibility
The desktop browsers tested during Cocos Creator development include: Chrome, Firefox and QQ Browser, other browsers can be used normally as long as the kernel version is high enough.
Browsers tested on mobile devices include: Safari (iOS), Chrome (Android), QQ Browser (Android) and UC Browser (Android).
Debugging with browser DevTools
Taking Google Chrome as an example, click Developer -> Toggle DevTools in the main menu of the editor to open the DevTools interface. DevTools, allow viewing the runtime log, using breakpoints to debug, viewing the value of each variable at each step in the call stack, and even performing asset loading and performance analysis.
To learn how to use DevTools for debugging, read the Chrome DevTools User Guide, or the DevTools help for other browsers.
Preview In Editor
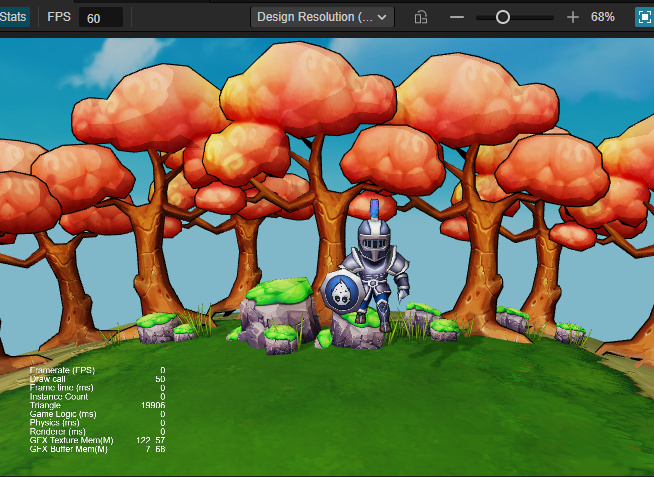
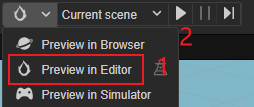
To preview within the editor, select Preview in Editor (mark 1 below) from the drop-down menu and then click on the Run Preview (mark 2 at the bottom) button to preview.
Click to pause the current preview, and after pause you can also single step by clicking
to run a single step.
When you don't want to continue the preview, you can click button to stop.
When selecting the editor preview, the preview output can also be configured via the menu at the top of the preview window.
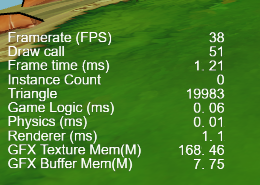
Click to select whether to display the following state within the view.
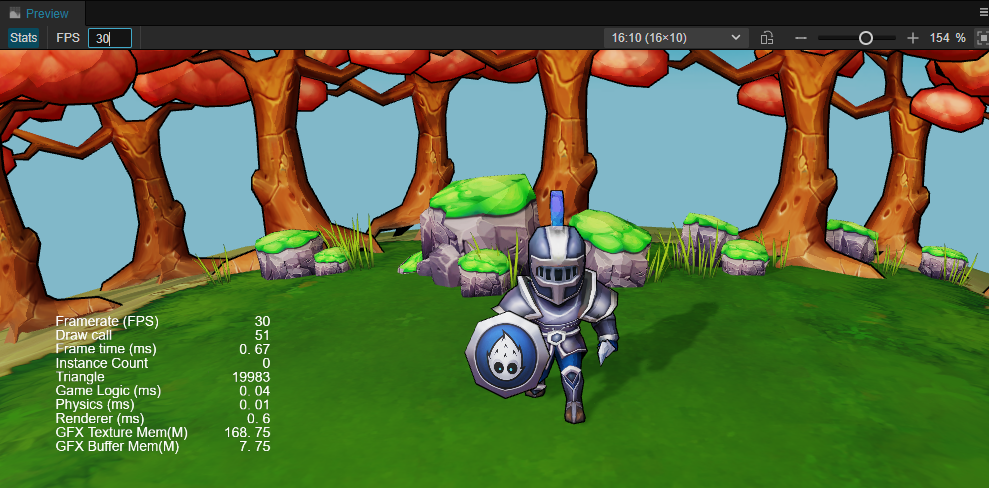
Maximum frame rate for previews, or you can enter a custom frame rate.
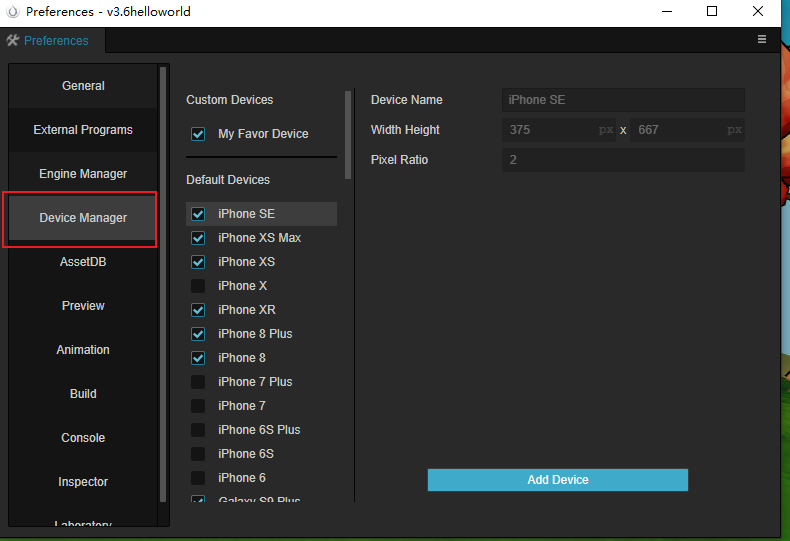
Resolution at preview, the drop-down menu allows you to select a different resolution, or if the current engine's built-in resolution cannot be met, you can pull the drop-down box to the bottom and select Edit.
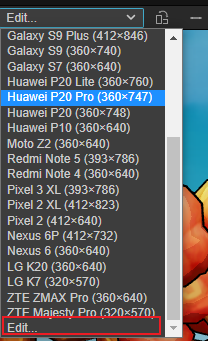
You can also add/modify/remove resolutions in Device Manager in Preferences in the top menu bar to add/modify/remove resolutions.
Toggle landscape/portrait preview
Zoom view
Adapting the game view to fit the current view
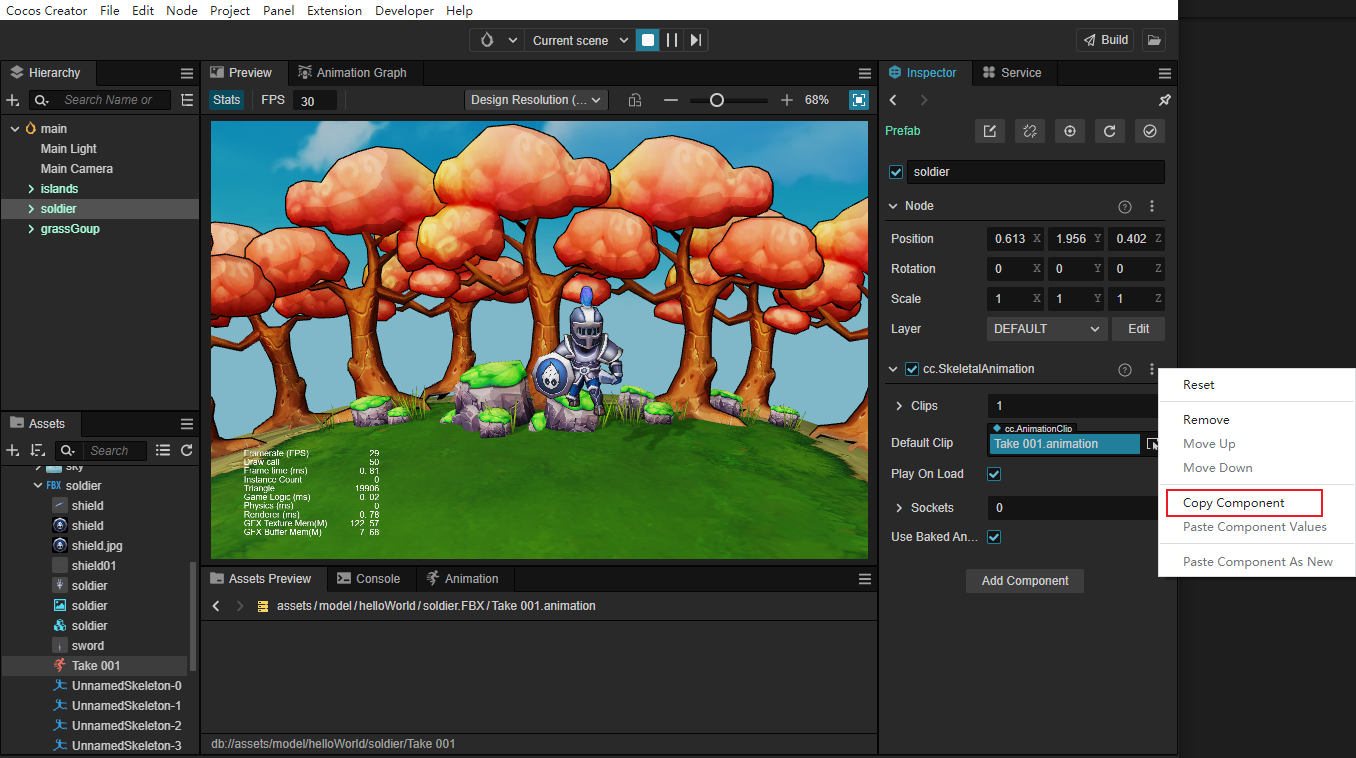
The properties of the component can also be modified for debugging within the Inspector panel during preview, but note that the data entered at runtime is not saved. If you wish to save the adjusted component, you can click on the Component Menu on the right and select Copy Component in the drop-down list, then select Paste Component Value after the preview exited.
Simulator
When you select Simulator preview, the current game scene will be run using Cocos Simulator (desktop simulator). When running the game with the simulator, log messages (printed with cc.log) and error messages from the script are displayed in the Console panel.
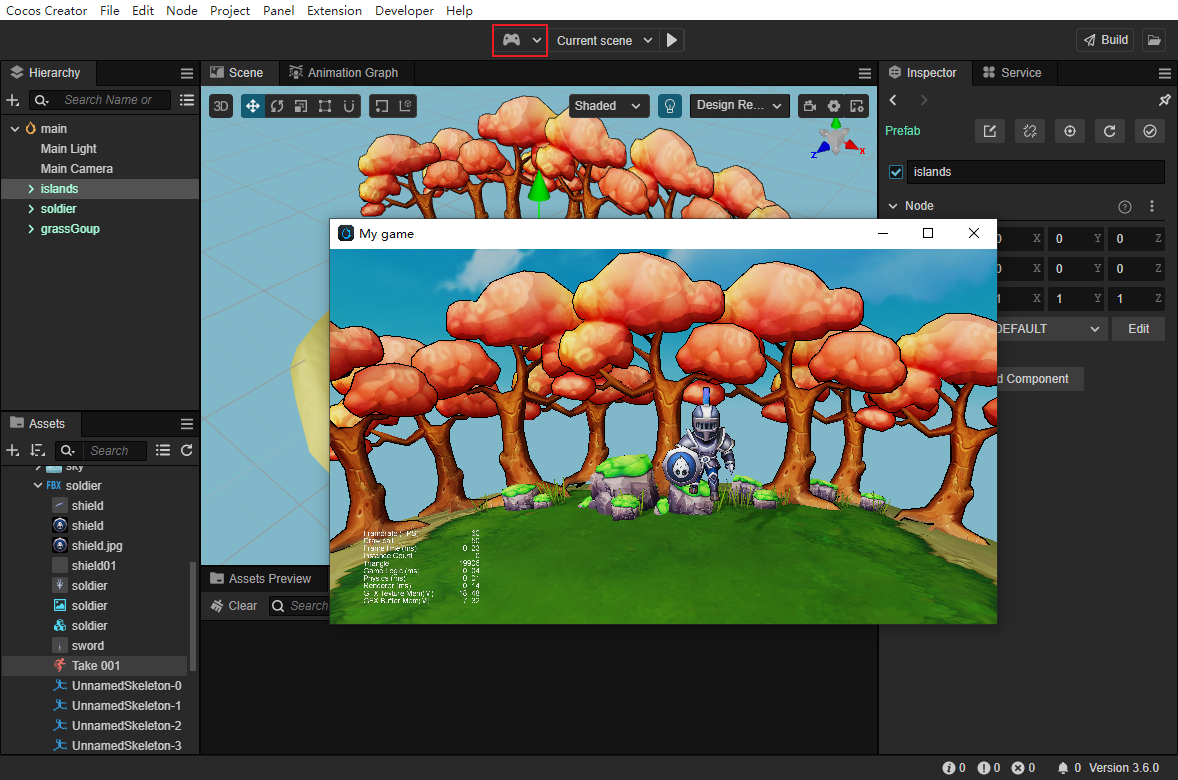
When using Simulator preview, it supports automatically opening debug window for debugging, which can be set in Cocos Creator/File -> Preferences -> Preview, please refer to Preferences - Preview.
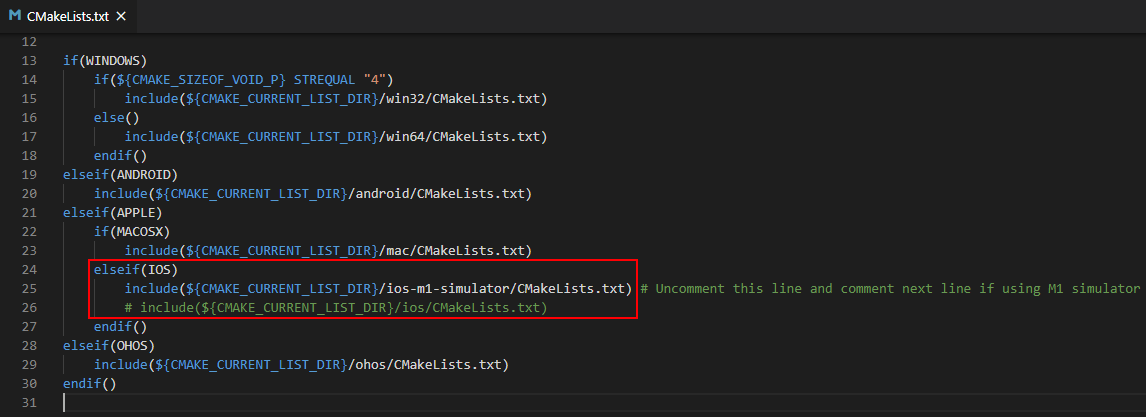
To add support for the iOS simulator on Apple M1 (Silicon) architecture devices, click the App button in the upper right corner of the Creator, open the CMakeLists.txt file in the resources\3d\engine\native\external directory of the Editor, and uncomment the code related to the iOS simulator and comment the code related to the iOS physical device, as shown below:
Mobile preview
There are the following ways to debug the preview effect on mobile phone:
Use Mobile Preview mode of Browser DevTools
Scan the preview QR code
Move the mouse over the IP preview address on the left side of the editor toolbar, a preview QR code will be displayed, just scan it with your phone.
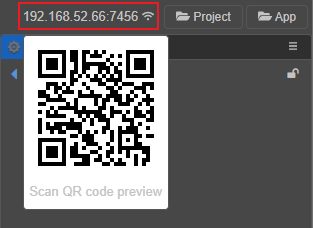
Directly Enter the preview address in your cell phone browser
Note: the phone needs to be on the same network segment as the computer. Since there may be more than one network for the computer, if the IP address of the editor preview URL is not selected correctly, change it in the main menu bar in Cocos Creator/File -> Preferences -> General -> Preview IP.
Build
After previewing and debugging, if you are satisfied with your game, you can open the Build panel via Project -> Build in the main menu to package and publish the game to the target platforms, including Web, iOS, Android, various "mini-games", PC clients and other platforms. For the detailed build and publish process, please refer to the Cross-Platform Game Publishing documentation.
Note: the effect of running the game with Simulator and the final release to the native platform may be somewhat different, for any important game features, please do the final test with the version after build and release.
