Native Engine Memory Leak Detection System
The native engine is developed using the C++ language. In order to facilitate game & engine developers to quickly find memory leaks, Cocos Creator provides a memory leak detection system since v3.4.0.
Compared with other memory leak detection tools, the built-in memory leak detection tool in Cocos Creator has the following advantages:
- Cross-platform: support Windows/Android/Mac/iOS platforms.
- Ease of use: no need to download additional tools and perform complex configurations. Support output of stack information at memory leaks, which is convenient for quickly locating leaks.
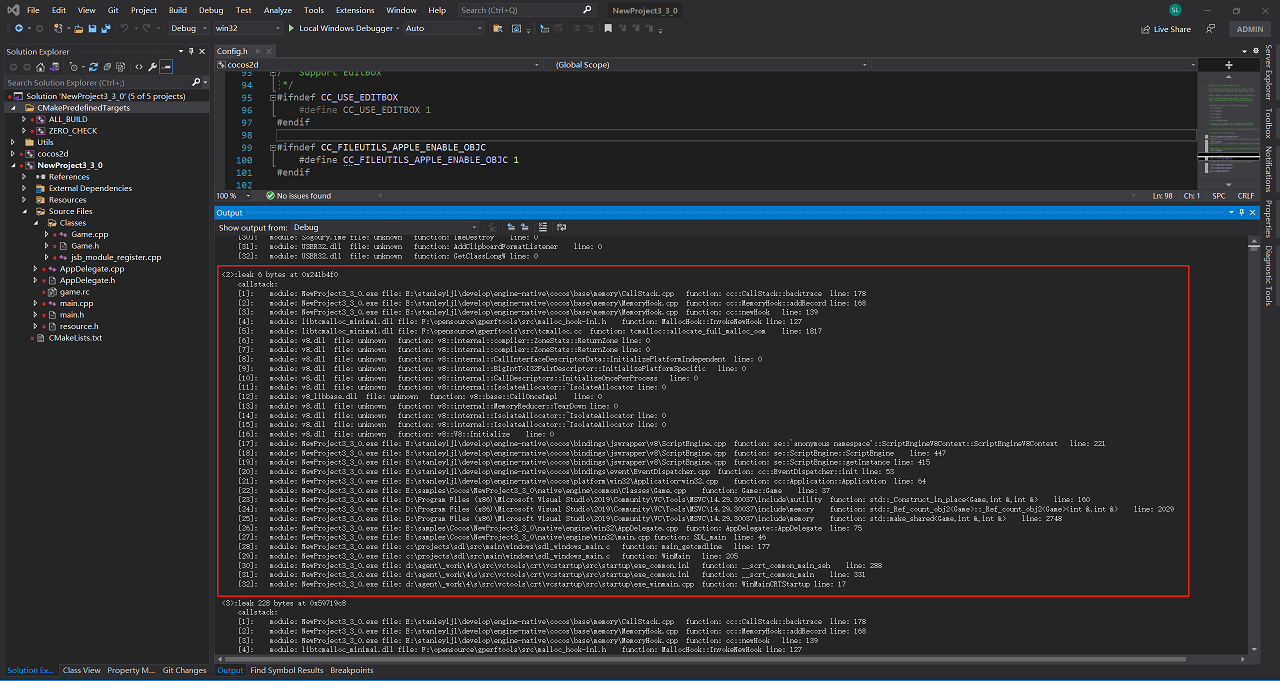
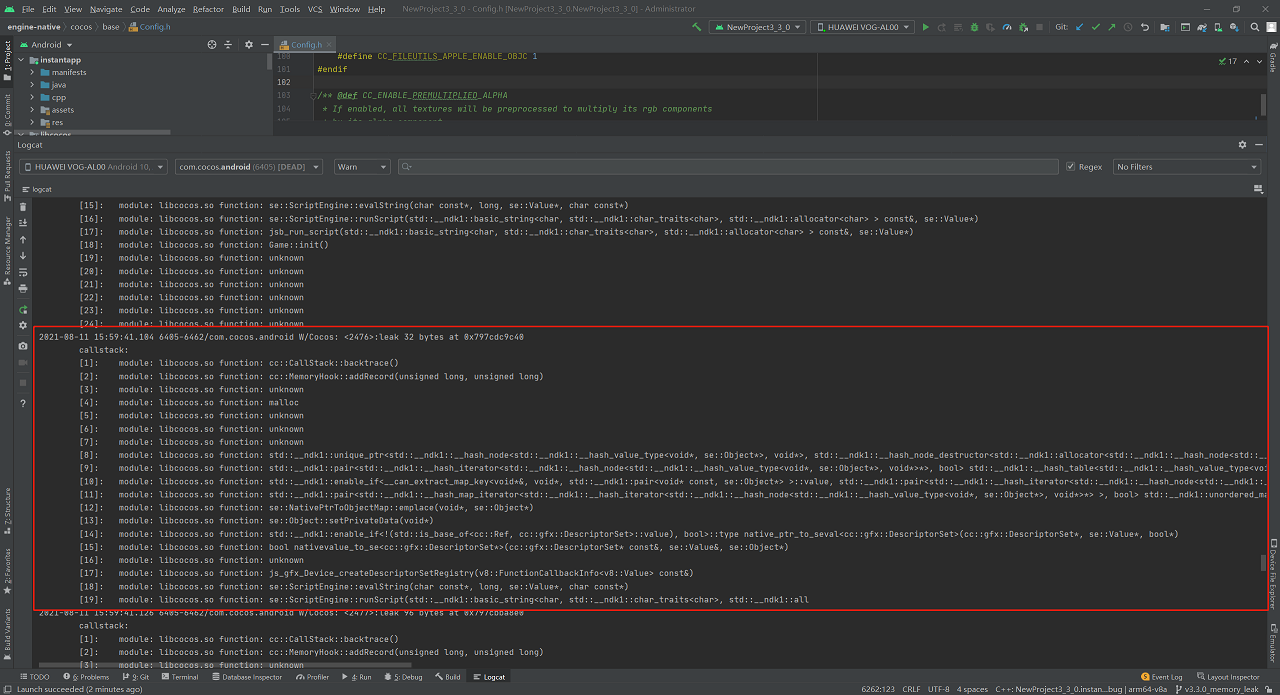
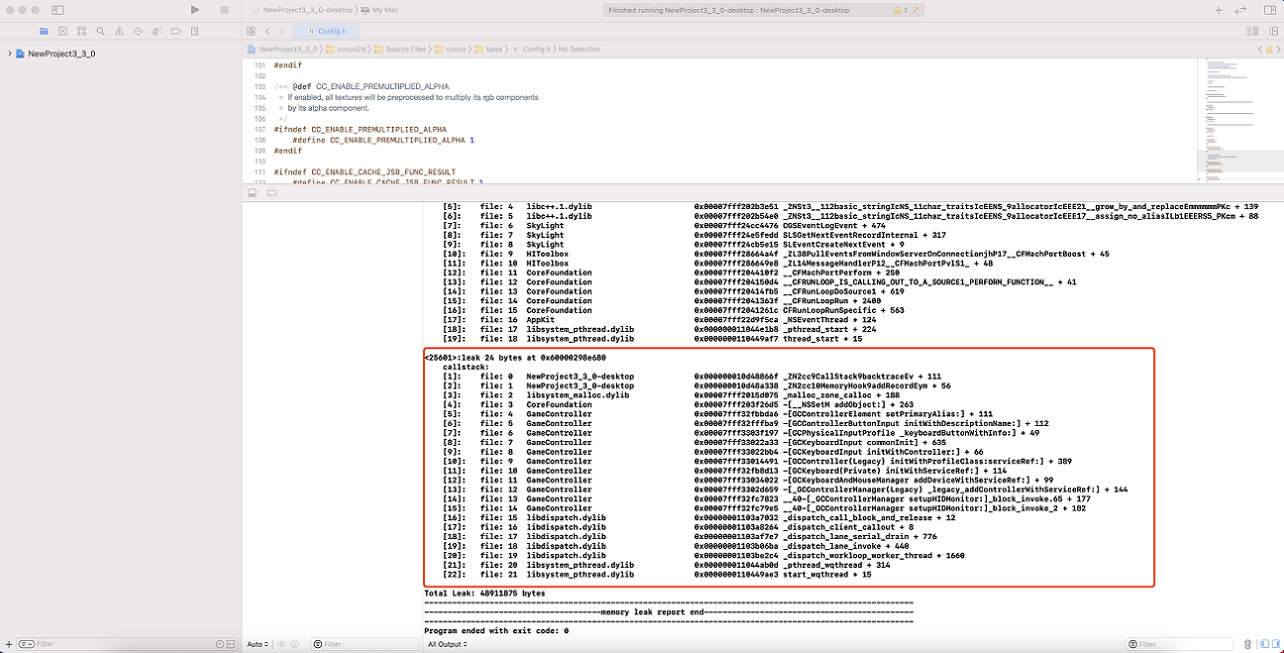
- Consistency: the usage process of each platform is almost the same: start the game from the IDE -> run for a period of time -> close the game -> view the IDE output log.
- Real-time: although the frame rate of the game in the profiling mode has dropped, it still maintains the real-time running frame rate.
- Accuracy: theoretically zero false positives.
Usage steps
The memory leak detection system is disabled by default. To enable it, you need to modify the value of the macro
USE_MEMORY_LEAK_DETECTORin theengine/native/cocos/base/Config.hfile of the engine directory to 1.c++#ifndef USE_MEMORY_LEAK_DETECTOR #define USE_MEMORY_LEAK_DETECTOR 1 #endifThe Android platform requires one additional step as a result of the different implementation mechanisms amongst platforms:
Add a line of code
set(CMAKE_CXX_FLAGS "${CMAKE_CXX_FLAGS} -finstrument-functions")to thenative/engine/android/CMakeLists.txtfile in the project directory, as follows:set(CC_PROJ_SOURCES) set(CC_COMMON_SOURCES) set(CC_ALL_SOURCES) set(CMAKE_CXX_FLAGS "${CMAKE_CXX_FLAGS} -finstrument-functions")Start the game from the IDE corresponding to the native platform (such as Visual Studio, Android Studio, Xcode), and close the game after running for a period of time. If there is any memory leak, the detailed information of the memory leak will be output in the output window of the IDE at this time.
Windows platform

In the Release version, if more friendly stack information is needed, right-click the executable project-properties, open the project properties page, and make the following settings:
Linker -> Debugging -> Generate Debug Info: Generate Debug Information(/DEBUG)
C/C++ -> Optimization -> Optimization: Disabled(/Od)\
C/C++ -> Optimization -> Inline Function Expansion:Disabled(/Ob0)
Android platform

Mac/iOS platform

Fix the leak according to the information output by the Native platform IDE, and repeat until there is no leak.
